The pain: you read the chart alone. Price does not show where market makers hedge, or where liquidity comes from.
The options trader's pain: your direction is right and the contract still loses, because you paid more premium than the move. Now: SPY at $763.96, below the Gamma Flip at $773.56.
The stock trader's pain: why does the breakout fail in your stock while the index rises? Distance from the 50-day average: SPY −0.5% and the equal-weight RSP +1.3%. 68% of companies are in a buyback blackout.
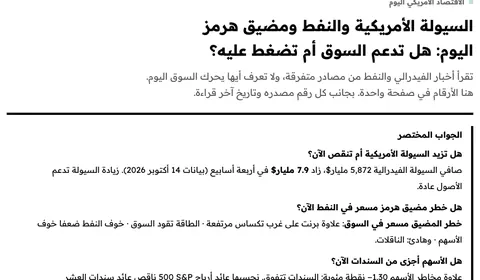
The investor's pain: you buy a good company in a week when the US Treasury drains liquidity from the market. Fed net liquidity now: $5.87T.
Don't trade against institutional liquidity.Before you open a trade, see on one page whether the market is calm or volatile today, and at which prices big options positions cluster, in numbers.
Right direction, losing contract?Know before you buy whether the premium is expensive, and where the Call Wall, the Put Wall and the Gamma Flip sit.
Do not let index highs fool you when leadership is narrow.Tie your stock pick to sector rotation, market breadth and the nearest options wall before you enter.
Invest with the liquidity, not against it.Follow Fed net liquidity, US Treasury auctions, credit stress and institutional 13F positions on one platform.
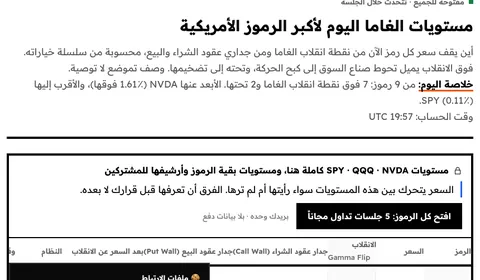
Five layers of US market data on one screen, with gamma levels for the major tickers updated every 5 minutes during the session.
The volatility risk premium compares what you pay for the contract with how much the stock actually moves, and gamma levels update every five minutes during the session.
When SPY rises and the equal-weight RSP lags, a handful of stocks lead the market and breakouts fail in the rest. Finviro shows market breadth, sector rotation and a card for every symbol in one place.
Markets move on liquidity and credit before earnings. Finviro combines the Treasury General Account, reverse repo and SEC filings in one reading before the open.
The problem and what you get in Finviro
✗You enter while liquidity is leaving the market.
In Finviro: The financial conditions index combines Fed net liquidity, funding stress and risk appetite in one reading before the open.
✗Price stops at a level you cannot see on the chart.
In Finviro: Gamma levels for each symbol: the Call Wall, the Put Wall and the Gamma Flip, updated every five minutes during the session.
✗You jump between five websites and cannot connect them.
In Finviro: The session ticket combines the five layers in one clarity score out of 100, with what raises and lowers it.
✗You buy a contract with a high premium and falling volatility eats it.
In Finviro: The volatility risk premium compares implied and realized volatility for each symbol: is the contract expensive or cheap right now?
✗You put your target behind a wall price struggles to pass.
In Finviro: The scenario lab builds the target and the stop from option walls and the Gamma Flip before you open the contract.
✗You do not know where big money is betting today.
In Finviro: Contract flow tracks large unusual contracts in real time, and net premium shows whether the direction is turning.
✗You buy a stock in a sector money is leaving.
In Finviro: Sector rotation measures relative strength and its momentum for every sector: who leads and who lags.
✗Earnings surprise you and price jumps past your stop.
In Finviro: The earnings calendar shows upcoming reports for the symbols you follow before their contracts are repriced.
✗You do not know where the ceiling and floor of your stock are.
In Finviro: The symbol card puts option walls, the volatility premium and flow on one page.
✗You build a position in a week when liquidity is being drained.
In Finviro: Treasury auctions and the Treasury General Account: how much liquidity they drain this week.
✗You buy a company whose earnings do not cover the interest on its debt.
In Finviro: Credit stress flags these companies, and stock comparisons measure five families of ratios from official filings.
✗You do not know what large institutions are buying.
In Finviro: Institutional positions from SEC 13F filings.
The engine flags when macro and options disagree, before you trade.
Fed net liquidity
$5.87T +1.4%
Treasury account (TGA), 1 week
+$3.1B
Reverse repo (RRP), 1 week
$0.0B
2-year yield minus Fed funds
+77 basis points
Average Treasury auction bid-to-cover
2.52x
Possible bottom · double bullish confirmation · Strong auctions: 4 of 6 · Institutions are buying to lock in yield, putting downward pressure on yields.
Follow the market's fuel: the Fed balance sheet and US Treasury auctions.
Volatility premium (implied ÷ realized)1.38xPriced high
VIX19.03VIX/VIX3M 0.95
GOOGL1.82xRich: implied above realized
NVDA1.49xRich: implied above realized
XOM1.83xRich: implied above realized
See when options are rich (implied above realized volatility) and when they are cheap.
Engine read: negative gamma (-1.24% from the flip) Negative gamma with stressed volatility: hedging speeds moves up instead of damping them. Moves run further than seems reasonable, and floors are weaker than they look.
Peak gamma strike
$780.00
Net options premium today
−$58M
Unusual contracts today
44
Shows the strike carrying the heaviest gamma, apart from the gamma flip.
The advance is broad: the equal-weight index keeps pace with the index (healthy participation).
See whether a rally is broad or carried by a few stocks.
Sources: US SEC filings · the Federal Reserve · US options exchanges · crypto exchanges
Morning verdict
SPY gamma negative, below $773.56
Net Treasury flow this week +72 billion dollars
Flow is balanced
WTI crude $107.89 (close Oct 20) decoupled from yields · Cushing +0.99M barrels week over week
Reading consistency Readings incomplete · Positioning: not published yet, or last published a week ago
Next Treasury event Next week's bill announcement · Oct 29, 2026 15:00 UTC · in 7 days
SPY gamma negative, below $773.56
Net Treasury flow this week +72 billion dollars
Flow is balanced
WTI crude $107.89 (close Oct 20) decoupled from yields · Cushing +0.99M barrels week over week
Reading consistency Readings incomplete · Positioning: not published yet, or last published a week ago
Next Treasury event Next week's bill announcement · Oct 29, 2026 15:00 UTC
From the Finviro engine · changes with the signal, not the clock · a positioning read, not a recommendation. Open the SPY map → · Macro desk →
What members say
"This platform completely changed my perspective 😊. The macro and gamma insights provide a clear structure before making any trade."anna c. · Trader · 🇮🇹 Italy · 4 months✓The member received one free day on the platform for this testimonial.
"A very good platform. There is no extension of the free period."عبدالله المحسن ا. · Trader · 🇸🇦 Saudi Arabia · 1 month✓The member received one free day on the platform for this testimonial.
"Honestly, I learned a lot from the data and from several things I did not know before."Hakim El a. · Beginner trader · 🇲🇦 Morocco · 5 months✓The member received one free day on the platform for this testimonial.
Personal views of users, not expected results. Trading involves risk, and we do not give investment advice.
Every number here comes from the platform's live data with its computation time · a description of what is happening, not advice · How we compute it
01
Inside the members areaMEMBER AREA
After hours · figures are a snapshot of the last close
Don't buy a stock or a contract blind
These are four panels from the live dashboard, and their numbers now are the engine's numbers now. This is what reading liquidity structure and institutional hedging looks like, instead of guessing.
Gamma map
Institutional support and resistance walls, and the Gamma Flip.
Last close snapshotSPY
Spot SPY$763.96
Exchange pricing · Oct 22 20:00 UTC · Closing price
US market analysis built around market structure Computed, not resold
Most platforms in this field show one layer at a time, on separate screens and subscriptions.Finviro computes the four layers itself and puts them on one dashboard:
Track record: the last three closed trades · as they are
Ordered by time, not by outcome. We did not pick the winners, so you may find a loss at the top. That is on purpose.
Fund scope: the systematic trade tracker
Three from the automated trade tracker: 13 winners and 27 losers (32.5% win rate).
Closed in the signal log228
Win Rate36%
Profit Factor1.2
Max drawdown−45.2%
Swipe to see all three trades →
Closed in profit
DUK+53.9%
2026-10-22 16:03 UTC
Trade duration: days
Thesis
Technical context at entry:EMA-8 ($119.13) above EMA-21 ($117.87) · short-term momentum up · MACD histogram positive (0.835) · upward momentum · RSI at 61.0: …
✓ Outcome
✓ The trade worked.DUK moved 2.4% in favor of the calls (from $120.78 to $123.64).It broke through resistance at $121.64.The contract premium rose +53.9% ($3.80→$5.85). …
✗ Trade closed because the structure broke.The flip level at $194.47 broke · XOP moved 0.2% in favor of the calls ($193.50→$193.95).Premium −8.8% ($8.72→$7.95). …
✗ Trade closed because the structure broke.The flip level at $194.47 broke · XOP moved 0.5% against the calls ($194.44→$193.50).Premium −4.5% ($8.72→$8.32). …
Trade calls you can't check, or data you read yourself?
Today, many traders decide either from late translations of platforms that don't speak their language, or from trade calls they can't check. The table compares the three approaches on what affects your decision: Who measures? In what language? And who shows their mistakes in public?
Engine status Gamma structure computed on 212 symbols7 hours ago · 104 options contracts tracked in the flow 7 hours ago
A comparison of categories, not verdicts on any one platformEvery cell about us can be checked
A comparison of categories, not a verdict on any one platform · every cell about us can be verified
No. The platform shows data calculated and explained: where dealer hedging limits the index's move · the Call Wall, the Put Wall and the Gamma Flip · plus liquidity and options flow. The decision is yours. And a gamma wall is a verifiable fact whether the trade wins or loses.
The platform is built for serious traders. If you understand options basics and how indexes move, you go straight to the tools; if you start from zero, you'll find a full Academy and a glossary of explained terms before you pay anything.
Gamma and options flow on the dashboard update throughout the session. The morning read at the top of this page comes from the same engine, and all times are shown in UTC.
No. The platform runs in the browser on any device. It doesn't connect to your broker account or execute trades · you read the data and analysis here and act on your decision wherever you like.
Yes. Signing up is free with just your email, and includes a full trial of every tool for 5 trading sessions with no payment details, starting when you confirm your email · after that the free tools stay open and the advanced ones sit behind the subscription, so you see what you pay for before you pay.
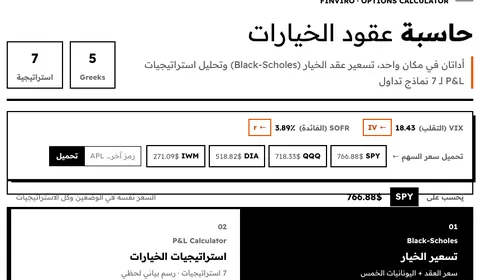
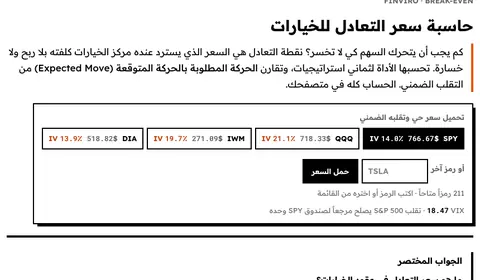
Options and Greeks calculator, position size and breakeven calculator, a scenario lab with options walls and the Gamma Flip, market hours in your time zone, the Academy, the glossary and the latest published report. All on the “Free tools” page.
Payment is in crypto, and your membership activates on its own once the payment is confirmed on the network. Membership is monthly or annual with no binding contract · Renewal is up to you: stop it from your account before the due date and access stays until the end of the paid period. Need another payment method? Message us from the “Contact us” page.
The Call Wall and the Put Wall are the two strikes where dealer gamma exposure is concentrated · near them, moves tend to slow or bounce, and the Gamma Flip separates a calm regime from a volatile one. The Academy explains them for free.
We use cookies and Google tools to measure visits and campaign performance, so we can build what actually helps you. The platform works fully whatever you choose.